Impact Measurement & Visualization Services
The Impact Measurement & Visualization (IMV) Team partners with the UNC-Chapel Hill community on impact measurement and visualization projects in support of research, education, and clinical care.
Health Sciences Library IMV specialists consult with individual faculty, research groups, institutes, departments or other units on topics such as:
- Communicating research impact and collaboration to audiences such as funders or promotion and tenure committees
- Managing or tracking publications
- Measuring or assessing research impact by discipline area
HSL IMV specialists partner with individual faculty, research groups, institutes, departments or other units and use a wide collection of resources, including Scopus, Web of Science, Journal Citation Reports, and more, to provide services and reports for different purposes,
including:
- Identify patterns, trends, and gaps of unit-supported research, education or clinical care activities utilizing publication and/or other available data
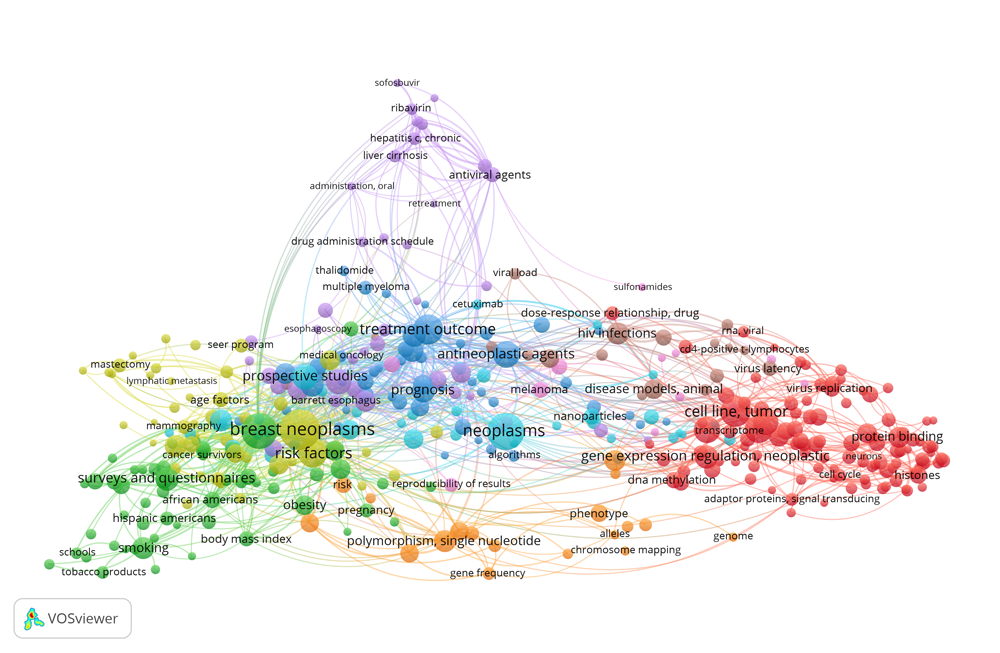
- Bibliometric analysis and visualization to provide an overview of research publications and other outputs by a specific group
- Discover the scope and pattern of research collaborations (e.g. author collaboration, institution collaboration, and country collaboration)
IMV Analyses and Data Types
Data Types
- Publication citation data
- Grant citation data
- Patent citation data
Analyses
- Individual author publication metrics
- Author/institution/country collaboration analysis
- Citation impact analysis of a group
- Topic analysis for a group using author or index keywords or title/abstract terms
- Bipartite (multi-node) networks: collaboration/topics over time
Highlights of a Typical Project Workflow
- Identify project scope, goals, project contacts, types of analyses, deliverables, and opportunities to collaborate on professional outputs (Project Charter)
- Identify and validate specific data to be analyzed, and data sources
- Construct search strategy in consultation with domain experts (clients)
- Retrieve and clean data (most time-consuming step)
- Run analyses; produce visualizations
- Share initial analyses with client for input and revie.
- Revise analyses as needed
Resources and References
-
IMV Project Examples: IMV Project Gallery.
-
We maintain the Measure Your Research Impact guide.
-
UNC-Chapel Hill COVID-19 Research Output & Collaboration Analysis (2021).
-
Yu, Fei, and Barrie E. Hayes. 2018. “Applying Data Analytics and Visualization to Assessing the Research Impact of the Cancer Cell Biology (CCB) Program at the University of North Carolina at Chapel Hill.” Journal of eScience Librarianship 7(1): e1123. DOI: 10.7191/jeslib.2018.1123
-
“Health Sciences Library helps UNC demonstrate impact.” Vital Signs, March 22, 2018. http://news.unchealthcare.org/som-vital-signs/2018/march-22/health-sciences-library-helps-unc-demonstrate-impact
-
Xing, Z., Yu, F., Mustafa, Y., Guan, T., Walker, J., & Song, L. Intelligent Conversational Agents in Patient Self-management: A Systematic Survey Using Multi Data Sources. 2019. Studies in Health Technology and Informatics 21;264:1813-1814. DOI: 10.3233/SHTI190661
Events & Outreach
Throughout the year, we offer events and workshops related to data visualization methods and software, and new offerings on tracking research impact. You can learn about upcoming events by consulting the Events Calendar.
Contact
- Submit a Request for HSL IMV services.
- Email us if you have questions about HSL IMV services.


